Chapter 19. Controls
One reprieve
from the correlation-does-not-imply-causation difficulty is to seek out data
that avoid certain problems with interpretation. Controls are essential to all
evaluation of causal models, and better controls can bypass some of the
problems in evaluating correlations.
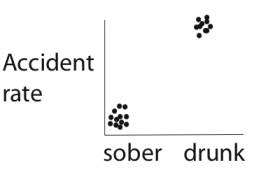
If drunk
driving is the cause of increased accident rates, then we should observe a
higher rate of accidents when a driver is drunk than when sober. More generally,
a causal model works on the simple principle that a substance or event (X)
causes something else to happen (Y). If the model is correct, we should observe
that Y occurs in the presence of X, but that Y doesn't occur (as often) in the
absence of X.
What underlies
this reasoning is a comparison:
- Y is observed along
with X (more accidents with drunk driving)
- Y is not observed
in the absence of X (fewer accidents with sober driving)
In order to
evaluate a causal model, therefore, the data must address both sides of this
comparison -- if we know only the accident rate for drunk driving and not for
sober driving, we can't say whether drinking raises or lowers the accident
rate. We need data for the baseline accident rate of sober driving, for comparison
to the accident rate of drunk driving.
These baseline
data are known as a control. A control serves as a reference point for the
study, i.e., a point of comparison. (In the Ideal Data section we introduced
the idea of a standard or control.
Here we extend the concept of a control for evaluating or interpreting a
model.) The following table lists control groups for various kinds of studies:
|
Model |
Control Group |
Treatment Group |
|
Smoking
causes cancer |
non-smokers |
smokers |
|
Smoking causes
cancer |
people who
smoke less |
people who
smoke more |
|
Aggressive
questioning by a lawyer is more effective than passive questioning |
outcome from
passive questioning |
outcome from
aggressive questioning |
|
Coca-Cola tastes
different than Pepsi |
People's
responses to the taste of Pepsi |
People's
responses to the taste of Coca-Cola |
|
People's
responses to the taste of Coca-Cola |
People's
responses to the taste of Pepsi |
|
|
A new
advertisement causes an increase in sales |
sales rates
under the old ad |
sales rates
under the new ad |
In some cases,
there is no clear boundary for the control group, but controls are nonetheless
present. For example, if our model is that increased smoking results in increased
cancer rates, then a control is present whenever people with different smoking
levels are included. There is no cutoff at which we say people are definitely
in or out of the control group, but controls are nonetheless included by virtue
of the comparison between different levels of smoking. In other cases, we can
say that a control is present, but there is no clear group which can be called
"control" instead of "treatment" (as in the Pepsi example
in the above table).
The control is
possibly the most vital design feature in studies testing causal models (or
other models which make a comparison). If the control group is chosen poorly,
then no amount of ideal data can salvage the study. It is relatively simple to
decide whether an appropriate control (or comparison) is present in a study:
Merely list how each group is treated, and list the observations that are made
systematically for all groups. A causal model can be evaluated with a set of
data only if
- (i) the data
measure the relevant characteristics described by the model, and
- (ii) the difference
in treatment between the groups matches the comparison given in the model.
As an example,
consider the model: aspirin lowers cancer rates. Any study testing this model
would need to measure cancer rates in different groups of people, and the
groups must differ in their exposures to aspirin. However, if one group
received aspirin plus a low-fat diet, and another group received a high-fat
diet without aspirin, the groups differ in more than just dose of aspirin. The
data generated from the study would lack an adequate control, because the data
could just as easily be argued to test a model of the cancer-causing effect of
high-fat diets.
The problem
with correlational data is that one often does not know how many factors differ
between the main group (treatment group) and the control group.
Eliminating Factors with a
Control
The purpose of
a control is to eliminate unwanted factors that could possibly explain a
difference between groups also differing in the factor of interest. If we want
to know whether smoking increases lung cancer rates, we don't want our smoking
group to be uranium miners with dusty lungs and our non-smoking (control) group
to be Himalayan monks, because any difference in lung cancer rates might be due
to other differences in environment instead of the difference in smoking. We
therefore want a control group to eliminate as many factors as possible other
than smoking/non-smoking. What we are controlling for in the control group is
not smoking (which is the "treatment" or main factor). Rather we are
trying to control for or eliminate the myriad of other factors that we don't
want to interfere with our assessment of what smoking does (we mean the same
thing by "control for" as we do by "eliminate" or
"match" a factor).
By "controlling
for"
or "eliminating" or "matching" a factor with a
control group, we mean merely that the factor is (on average) the same between
the treatment and control groups. That is, the control group attempts to be the
same as the treatment group except for the treatment factor. Thus, if our smoking group consists of
(smoking) uranium miners, our control group should likewise consist of
non-smoking uranium miners.
A factor can be
controlled for if
(i)
it
is absent in the treatment and control groups,
(ii)
it
applies to everyone in the control and treatment groups, or
(iii)
is
present in only some members of each group but is present to the same degree
between control and treatment groups.
Control groups that
match the treatment group in every possible way other than the treatment thus
eliminate all possible unwanted factors. But typically (except in the best
experiments), it is not possible to obtain such a perfect match between
treatment and controls.
Better Controls
From the point
we just made, not all controls are equally good, even if they are all
considered adequate. Consider the British nuclear power plant example from
Chapter 2, in which higher cancer rates were observed in people living near
nuclear power plants than in the population at large. Residents living near the
power plants are the "treatment" group (exposed to the possible
environmental hazard). Controls are thus people not living near the nuclear
power plant. These controls could, in principle, be comprised of
control
(i):
all other people living in Britain
control
(ii): people
living at environmentally similar sites as the power plant locations but
lacking a nuclear power plant
control
(iii): people
living at sites of the power plants after the plant was built but before any
radioactive material was brought in.
While all of
these groups would be considered acceptable controls, some seem better than
others. Why? The reason is that some control groups match the treatment
group for more factors than others and thereby enable us to reject more
alternative models than others. Here are 3 models that we might consider for
the elevated cancer rates:
- model (a): The radioactivity
from nuclear power plants causes cancer. Cancer rates will thus increase
after the plant is built and comes on line because only then is
radioactivity present. The factor of interest is radioactivity.
- model (b): Nuclear power
plants do not cause cancer but are built in areas of poor environmental
quality which cause the elevated cancer rates. The correlation between
cancer rate and area of residence (near or far from a nuclear power plant)
stems from a correlation between environmental quality and sites chosen
for nuclear power plants. The factor of interest is thus environmental
quality.
- model (c): Once a site is
targeted for nuclear plant development, land values decrease, and the
people who move in have cultural practices that predispose them to higher
cancer rates. There is thus a hidden correlation between social culture
and area of residence. The factor of interest is thus social culture.
These three
models collectively propose three different factors as the cause of elevated
cancer rates: radiation, environmental quality, and culture. The latter two
models suppose correlations among hidden variables and can be ruled out if
control groups are appropriately matched with residents near nuclear power
plants.
The first
control group (i) does not eliminate either of the factors in (b) and (c) and
thus would not allow us to distinguish among any of these models - low cancer
rates in the control would be consistent with all 3 models. Control (ii)
matches both groups for the environmental factor and could allow us to reject
model (b): if cancer rates were lower in environmentally-similar sites lacking
nuclear plants then we would reject the idea that environmental quality was the
cause of cancer. Control (iii) eliminates both the environmental quality and
cultural factors and thus could allow us to reject models (b) and (c): if
cancer rates were low immediately before the plant started running but
increased later, we could reject all models in which cancer rates were high
before the plant opened [of which (b) and (c) are examples]. We thus say that
control (iii) is better than (ii) because it matches more factors, and both are
better than (i), again because they match control and treatment groups for more
factors than (i).
The way to
assess the quality of a control group is thus to consider the possible factors
causing cancer (i.e., the different causal models) and to compare the control
groups with each other and with the treatment group to see if some are superior
to others. That is, which factors are matched between control and treatment
groups; if they are matched, we say they are eliminated:
|
|
Factor |
|||
|
Group |
Power Plant
(radiation) |
Britain |
Environmental
quality of power plant sites |
social
culture similar to residents near power plants |
|
Treatment |
+ |
+ |
+ |
+ |
|
Control (i) |
- |
+ |
- |
- |
|
Control (ii) |
- |
+ |
+ |
- |
|
Control (iii)
|
- |
+ |
+ |
+ |
The third
control is thus matched to the treatment group better than the other two
controls.
From this
illustration, we can also see that the number of alternative models is
virtually unlimited. But for each model, we can imagine a control group that
would allow us to distinguish it from many of the important alternatives. By
and large, we want controls that enable us to reject many of the alternative
models. In this nuclear power plant example, we are chiefly interested in
whether the radiation causes cancer, so we would want control groups that allow
us to reject lots of alternatives to this possibility. Clearly, however, we can
never find the perfect control group for all alternative models.
A second (hypothetical) example: GPA and
Social Activity
Suppose for the
sake of illustration, we observed a negative correlation between a student's
GPA and the university-related social activities of a student:
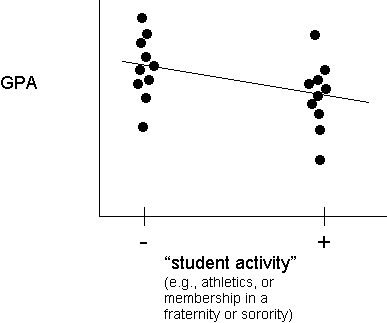
There would be
many possible causal models to explain this correlation:
1)
activities limit time for studying, and studying causes better grades
2)
the more "social" students are less prepared or able academically
3)
the more "social" students set higher personal goals and take harder
courses, which is the cause of poorer grades
4)
students adopt activities in response to poor grades early in their college
career
and so on.
As in the above
example with nuclear power plants, many of these alternative models suppose
that there are additional factors (variables) underlying this correlation and
that one of those hidden variables is the cause of the correlation. To
eliminate a factor, the correlation between GPA and "activity" would
have to remain negative even when the control group was "matched"
with the main group so that the hidden factor was the same in both:
|
Factor |
Control
group that would eliminate the factor |
|
study time |
students w/o
"activity" who study as much (little) as students with the
"activity" |
|
academic
preparation and ability |
students w/o
"activity" that had similar high school grades and SAT scores as
students with "activity" |
|
course
difficulty |
students w/o
"activity" taking same courses as students with the
"activity" |
|
early grades |
students w/o
"activity" with similar first-year grades to those with the
"activity" |
Of course, if the original correlation
disappeared when the control group was matched with the main group for a
particular factor, we would then suspect that the actual cause of the correlation
was that controlled factor.
In some cases,
this approach of controlling for factors one-by-one is all that can be done.
But there is no end to the number of such factors that can be considered, so
this approach is limited.
Diet and Heart Disease
Rates of heart
disease are higher in the U.S. than in Japan (and many other countries). Two
possible reasons for this difference are (i) genetics, and (ii) culture. That
is, genetic differences between U.S. citizens and Japanese citizens could
result in U.S. citizens being more prone to heart disease. Alternatively, the
cultures are different enough and heart disease is so influenced by culture
(diet), that the difference could be mostly cultural.
The most basic
control is the comparison of heart disease rates between Japan and the U.S. A
better control is to use heart disease rates in people of Japanese descent
living in the U.S., so that culture is somewhat equalized between the two
groups of different genetic backgrounds. Or we could compare Americans living
in Japan with the Japanese in Japan. When the control group is taken from
Japanese living in the U.S., the difference in heart disease largely
disappears. (Japanese living in Hawaii are intermediate.) So this better
control enables us to reject an important alternative model.
Calculating an Expectation
A control
serves merely to show us of an expected result in the absence of a particular
treatment (a baseline, as we have said). There are times when a control can be
calculated, without gathering data. For example, we may easily calculate the
odds of winning a lottery, of obtaining any particular combination of numbers
when rolling dice, and in other games of chance. These calculations can be very
helpful in a variety of other circumstances as well. For example, people often
marvel at the occurrence of seemingly rare and improbable events (e.g., having
a "premonition"). Calculations can show us just why these
individually improbable occurrences should happen, without invoking anything
mysterious.
Copyright 1996-2000 Craig M. Pease & James J. Bull