HOMEWORK #3 Correlations
(see Syllabus for due date and points possible)
Note: Some possible sources for articles include:
New York Times
(click on the SCIENCE section)
BioMedNet Magazine
Objective
Find an article that describes a correlation with the goal of understanding causation (e.g. women who consume 1-5 drinks/week have lower fertility than women who don't drink). Then fill out the correlation template pdf. These instructions should help you see the alternative ways of interpreting the correlation described in your article. NOTE: This assignment probably won't work well with a controlled experiment. You want a study with a correlation that did not come from an experiment.
Detailed instructions for the "ideal" homework assignment follows. You will actually upload the fillable pdf form along with your article, but the instructions here are intended to help you know what to type in the pdf fields.. For each feature of the correlation template, the type of answer that is expected is indicated. Also see our guidelines for doing homework assignments, but especially note that
i) the depth/detail in the article is important to your score; articles that don't offer sufficient detail will prevent you from scoring well.
ii) the article must be less than 9 months old
iii) upload the article (a copy is OK) along with your filled pdf form on your Canvas account for this class
How to use the Correlation pdf template
Name: Type your name in the field.
Article: Type the title, source, and date of the article on the pdf. Upload the article (as a scan, if need be). We want to be sure we have access to the article, so a little redundancy does not hurt.
1. Goal: Answer one of the following questions;
What was the purpose of the study?
What question did the author of your article seek to answer?
II. The Correlation: be sure this
is the correlation you discussed in the remainder of this assignment.
1. Quote: Give a direct quote from the article that
describes the correlation.
If the quote makes reference to causation, make sure that it also describes a correlation. For example, "drinking alcohol reduces a woman's fertility" is a statement of causation, whereas "women who consume 1-5 drinks/week have lower fertility than women who don't drink" is a correlation.
Next, identify the two variables
that are correlated in your article. If there are more than two correlated
variables, you may limit your assignment to two, but make sure that parts
III and IV correspond to the two variables you chose.
2. First variable: For the example given under "Objective" above, your answer would be "alcohol consumption." In general, your answer will be only one or a few words; it need not be a complete sentence.
3. Second variable: For the example given under "Objective" above, your answer would be "fertility"
4. Control Group: What was the control group? For the example above, it would be the women who in the study who did not drink alcohol.
5. Treatment Group: What was the treatment group? For the example above, it would be the women who drink alcohol.
III. A Model that Postulates a Causal
Relation Between the Two Correlated Variables:
State a causal model which postulates that changing one of the variables causes a direct change in the other variable. For the correlation described in "Objective" above, one could answer: "drinking alcohol reduces a woman's fertility." If this model is not mentioned in the article, you will need to think of one of your own.
IV. Provide an alternative explanation of
the correlation with a model that postulates a third (or hidden) variable that
causes the correlation
Do this in the following manner.
1. List one factor that the available data control for between the control and treatment groups. This should NOT be either of the variables given above in II.2 and II.3, because those are the main variables of the study and are not controlled for (in the sense of being the same in treatment and control groups). The article may not state or give any clue about factors controlled for, so you may have to put down "None identified." However, if by reading the article you can infer a factor that was controlled for, then you will be given more points for identifying this factor than by claiming "none."
2. List one factor that the available data do not control for. If the study involved randomizing people between control and treatment groups (and blind, where appropriate), then there may be none, and you will have to state "None -- randomized, blind study."
3. Using the uncontrolled factor you just identified, state a model in which this correlation is caused by a third (or hidden) variable. This 3rd variable should be of the type
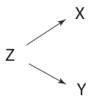
not the form X → Z → Y. For the correlation described in "Objective" above, you could state "Women who drink more have lower conception rates than women who don't drink, but the cause of reduced fertility is a stressful social environment that also causes the woman to drink more." This model should thus explain the correlation in II. If the article does not mention this alternative model (or does not list a factor not controlled in the data), you will need to think of one of your own. Try to avoid trivial factors.
If the answer two IV.2 was "none," you need to provide a model nonetheless. Start your answer "Had the study not been randomized, we might suppose that women who drink more have lower conception rates than don't drink, but the cause of reduced fertility was a stressful social environment that also caused the woman to drink more."
Homework: Guidelines and other Assignments
301C@bull.biosci.utexas.edu